Mihnea Tufis, Eurecat, WP4
With Month 24 of the Safe-DEED project we reach an important milestone: the release of the first version of the Data Valuation Component (DVC). It represents the next development step following D4.2 – Baseline prototype for data valuation, released in November 2019. The new features are based on the results of an extensive state of the art review of methods for data valuation (deliverable D4.3), and the contributions about legal, ethical and privacy perspectives from our colleagues at KUL (WP6).
The goal of the DVC is to perform the valuation of a data set over three aspects: data quality, data exploitability and economic value. The current version of the DVC receives a structured data set, together with a context and a set of rules for evaluating data quality and returns three scores which describe the value of the data:
- a score based on the contextual information provided;
- a score based on the quality rules provided;
- the aggregate value of the data set currently computed as a mean of the 2 previous scores.
Updates from previous version
This is a list of the improvements to the Data Valuation Component (DVC), compared to deliverable D4.1.
- Improvement of the architecture for the sub-components and the data flow; subsequent code refactoring.
- Implementation of an improved GUI, based on HTML and Bootstrap, to replace the less user-friendly console interactions.
- Data Ingestion Layer. Development of a friendly method for ingesting the data set.
- Context Processing. Development of a 5-steps process to establish the context under which data valuation is performed. This replaces the previously tedious process of preparing a custom JSON file with the context representation.
- Data Quality Requirements. Development of a multi-step process for creating data quality rules that will be applied during the data quality assessment (DQA). Supported by an intuitive GUI.
- Scoring components. Development of methods for computing the contextual (QDSC) and data quality (ADAS) scores. These are then aggregated in a final data value (S2VM).
- Communication and Presentation Layer. Development of a user-friendly method for presenting the three valuation scores (context, quality, aggregate), enabled by HTML and Bootstrap2. The values of the scores are highlighted by a colour scheme (red, yellow, green) to promote the interpretability of the results.
Architecture
The DVC comprises of the following modules:
- Qualitative information extraction and Data Scoring Sub-Component (QDSC);
- Data Ingestion Layer (DIL);
- Automatic Data Analysis and Scoring (ADAS);
- Score-to-Value Mapping (S2VM);
- Communication and Presentation Layer (CPL).
Data Ingestion Layer (DIL)
The data is currently ingested via a GUI, where the path to the data set is specified. The layer detects the data format and performs the suitable operations for ingesting it. The formats supported at the moment are CSV and XLS(X). For XLS(X) files, you can select the spreadsheet that you want to import. If none is selected, the first one will be considered by default.
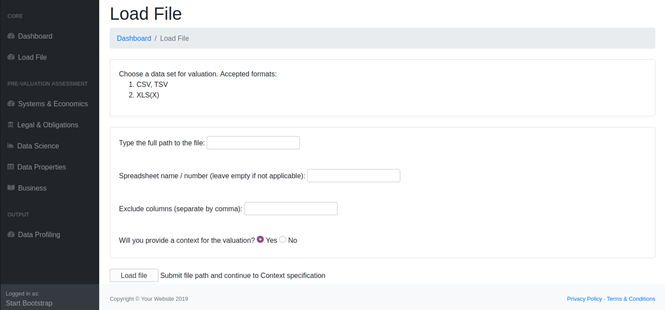
Figure 1: Load the data file
Qualitative Information Extraction and Data Scoring Component (QDSC)
The first stage of the data valuation process directly involves the user, who is required to provide information about the context in which they wish to valuate an input dataset. This is achieved by a multi-step questionnaire focusing on the following aspects:
- Systems & Economics: Availability & access, Purpose
- Legal & Obligations: Data protection, Legal-Terms-Obligations
- Data Science: Tools, Format
- Data Properties: Data velocity, Data transformations, Data quality, Data age
- Business: Frequency of use, Benefits
In the interest of reproducibility of the valuation process, the context is encoded as a JSON file and available for download and reuse. Finally, the component computes and returns a context-based score (QDSC-score).
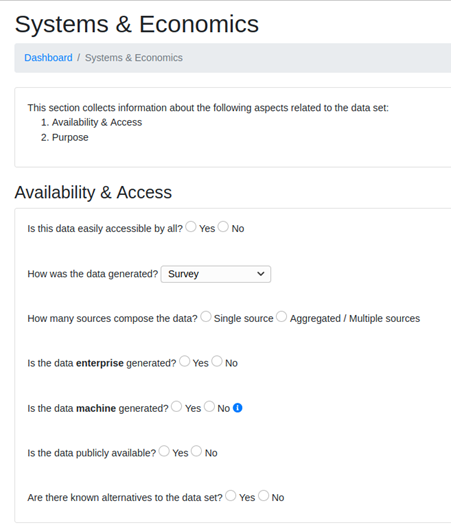
Figure 2: Fragment from Step 1 (Systems & Economics) of the Context Processing Stage
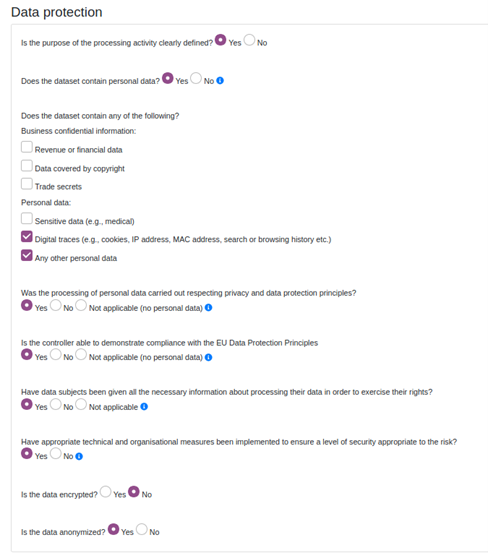
Figure 3: Fragment from Step 2 (Legal & Obligation) of the Context Processing Stage
Automatic Data Analysis and Scoring (ADAS)
Initially performs profiling of the input data set and reports on the following:
- data shape and size;
- data type inference;
- the profile of each field:
- missing values;
- distribution of the data from each field;
Based on the information extracted about the structure of the dataset, the ADAS then initiates a multi-step process for collecting any data quality rules applicable to each of the columns of the data set. The current version of the component performs data quality assessment for the following data quality measures:
- completeness (% of missing values or equivalent)
- two types of validity:
- domain validity (% of values in a defined range / domain)
- format validity (% of values that respect specific formatting rules)
The current version makes use of a basic textual format for describing the rules, which we intend to enhance (perhaps develop in a more graphical manner) for the final version of the component.
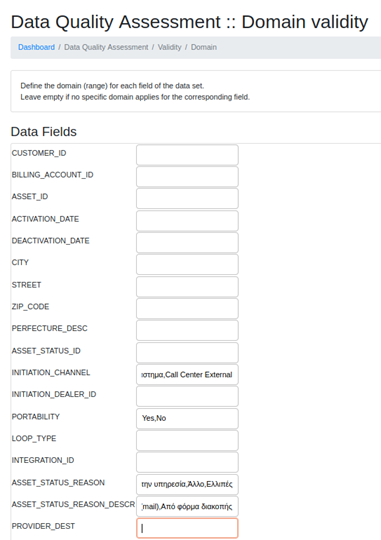
Figure 4: Step 2 Definition of data quality requirements for domain validation (Step 2)
Just like in the case of contexts, in the interest of reproducibility, the data quality rules are encoded as a JSON file and available for download and reuse.
Next, the ADAS uses the loaded data and performs the data quality assessment against the provided quality rules. Quality scores are subsequently computed for each data quality dimension, which are finally aggregated (as a mean) into an ADAS-score.
Score-to-Value Mapping (S2VM)
Using the two previous scores (QDSC-score and ADAS-score), this component aggregates them into a final score (as an average) – the data value. While this method is still simplistic, it validates the full data flow through the component and leaves the door open for the addition of economic models for data valuation, which will be integrated for the final version of the DVC.
Communication and Presentation Layer (CPL)
This layer acts as an interface with the user, to report the final results of the data valuation process. It displays in an integrated GUI the following:
- the QDSC and ADAS scores, together with a 3-colors code;
- the aggregated value of the dataset, together with a 3-colors code;
- a report of the dataset profile, available both as part of the GUI (HTML), as well as in PDF format.
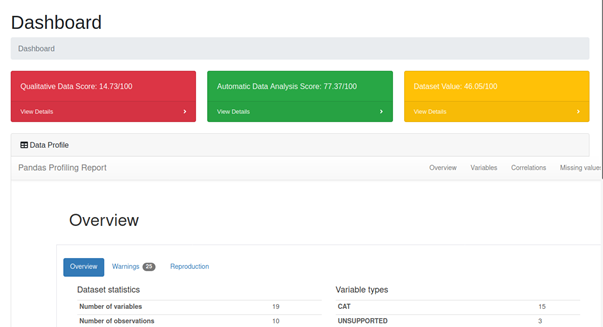
Figure 5: DVC – Output scores and colour codes
Next steps
- UI and UX improvements
- extend the capabilities of the current dimensions. Allow for the definitions of additional types of rules for domain and format validity.
- extend to more dimensions.
- Time-related measures are on top of our priorities (age, currency), together with the underlying decay models.
- Availability and accessibility are currently declared by the user as part of the context gathering process and quantified within. We want to study the possibility of automatising this (probably once the platform is deployed in a data market) and considering their scores as independent DQMs.
- Security and privacy. We are looking forward to the integration with the work in WP5 which could open the possibility of estimating these DQMs and include them in the final score.
- Performance. This measure will refer to the usability of the data set in intended contexts (e.g., advance analytics, training machine learning models).
- Improve the current aggregate measures, by using economic models for data value, which make use of the declared context.
- Integrate the work on privacy preserving techniques currently developed by RSA (WP5).