Ludovico Boratto, EURECAT, Leader WP 4
The “Big data is the new oil” analogy is one of the most omnipresent clichés to appear in the last several years in research, technology, and business. Resisting the temptation to dismiss it as just a marketing gimmick for selling expensive equipment and services to large corporations, there may be more to the slogan than meets the eye. Knowledge extracted from big data can indeed be valuable but like oil, no one can say in advance, and before “drilling” and “distilling” it, how much knowledge hides within a large source of data, be it mobility patterns, financial data, or web click streams. The big problem here is that, like in oil extraction, drilling tests are very expensive. The equivalent of drilling for knowledge extraction from big data is investing in the platform to collect and process the data. It makes no sense to invest millions in such a platform if the knowledge to be extracted from the data can be obtained in simpler and cheaper ways (e.g., through consulting). The oil industry tackles this “chicken and egg” problem by conducting much less expensive seismic studies before proceeding with expensive test drills.
For these reasons, the Safe-DEED project will include a Data Valuation component to offer to the big data industry a quantifiable incentivizing mechanism-its own seismic study apparatus, i.e., an affordable process and accompanying tool and technology, for predicting the knowledge value of a certain corpus of big data without, however, having to mine it, i.e., collect it at large scale, first.
Before building such a component, it is important to identify the types of potential data customers, the economic contexts in which these customers would like to perform data valuation, the type of questions that they would ask, and the type of output that they would expect from it.
For this reason, we compiled an online survey that was sent to different stakeholders. The collected information was then used to develop the functional requirements for the Data Valuation component, while also taking into account technological requirements (scalability, fault tolerance, quality of experience, security, privacy, etc.). Finally, the task involves a high-level architectural design of the component, including the final choice of a technological stack.
In this article, we focus on the results of the survey and the functional requirements that we extracted from it.
The survey was sent to professionals from organizations whose business involves the consumption and/or production of data. Most of the companies are based in Catalonia, but most of them have a global reach; some of these organizations are from the rest of Europe. A total of 19 participants – representing professionals using data from different perspectives (decision makers, managers, research, development) – responded to our questions. In the coming months, we plan to launch a large-scale survey to get more diverse and representative insights from stakeholders in the data market.
Overview of the results
Figure 1 and Figure 2 illustrate the business sector and the size of the companies and organizations taking part in the survey. Similarly, Figure 3 describes the roles each of the respondents take in their organizations. This allows us to get a better understanding regarding data needs, data interactions and data exploitation at different levels in an organization.
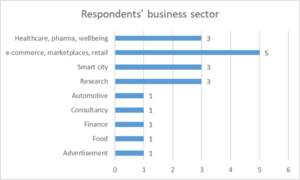 Fig. 1 – Business sector of respondent organizations
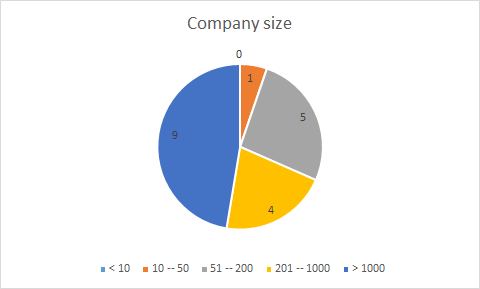 Fig. 2 – Size of respondent organizations
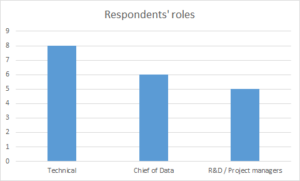 Fig. 3 – Respondents’ roles within their organizations
Two different trends are standing out in terms of transacting with data sets. The majority of the respondents (16) reported that they bought data from external sources; however only a minority (4) declared that they sold data that their business generated. Thus, there seems to be a clear need for companies to acquire data, doubled by a reluctance to share or sell whatever data they are generating.
Buying data
When acquiring data, respondents tend to look for the following types of data:
- traffic, transportation, geo-location;
- weather, satellite;
- retail, customer-related (demographics, behavior);
- social media;
- company data, financial data.
Looking at the companies that don’t acquire data, we observe that in general they are medium or large companies (over 1000 employees), from the retail or health-care sectors. A reason for this could be that they are self-reliant on generating all the data that they need to achieve their business goals.
Next, we wanted to understand how organizations are evaluating the importance of several features of the data they acquire, in the context of their projects. The survey proposed a 5-levels scale (not important – 0, slightly important – 1, important – 2, somewhat important – 3, very important – 4):
Accuracy (how close to reality is the data). Based on our results, this feature is unanimously appreciated by data practitioners; all our respondents rated it as being at least “important” and 14 of them (74%) appreciated it as being of utmost importance. Its average score was of 3.68;
Timeliness (how up to date is the data). The minimum evaluation that this feature received by all but one of the respondents was “important” (i.e., in almost all the cases it received a score of 2 or more). Its average score was of 3.12;
Completeness (proportion of missing values). This feature had the exact distribution of responses as timeliness. A majority of respondents (15 – 79%) considered this feature to be at least “somewhat important”, with the average importance of this feature being at 3.12;
Accessibility (how easy it is to find the data). In some sense, this feature refers to the availability of a given dataset. Almost all respondents ranked it as being at least “important”, but opinions were more uniformly split between the higher degrees of importance, with an average rating of 2.84;
Size. This feature seems to have been the most divisive, with answers being very uniformly split between the different degrees of importance, resulting in an average score of 2.21;
Uniqueness (proportion of unique records). The perceived importance seemed to be more uniform for this feature, with a majority of respondents (11) judging it “slightly important” or “important” at best. The average importance of this feature is 2.00.
This analysis allowed us to understand which features are of clear importance to all data practitioners and which of them are more divisive than others. Once the large-scale survey will be conducted, we hope to better understand the expectations that different stakeholders have from the data they wish to acquire.
Finally, we compiled a list of other important attributes, as suggested to us by the respondents:
- Structure – whether the data is structured or not;
- Provenance – the origin of the data;
- Ethics – whether the data was obtained by respecting regulations for data collection, use and exchange;
- Standardization – whether the data respects standard domain formats;
Selling data
As previously mentioned, only a very small number of companies (4 – 21%) actually sold data that they generated. Yet again, these are medium or large companies (e-commerce, consultancy), which are able to generate volumes of data useful to other businesses. An interesting segment is represented by organizations that generate data of public interest and are publishing them in an open and free manner. This is the case of research centers, which produce data as part of public funded projects and are required to publicly share this data in return. While this doesn’t necessarily count as selling data for a profit, these datasets are available for use and should be valuated nevertheless. As for the types of data usually sold, they tend to correspond to those already reported when acquiring data (e.g., demographic, customer, retail, transportation, geo-location, weather, social media, financial).
Looking at the majority of the participants in the survey that reported that their organizations never sold data, Figure 4 resumes the main reasons behind this.
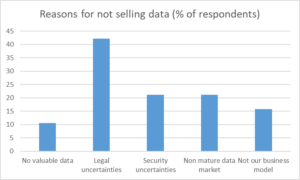 Fig. 4 – Reasons for not selling data
The main reasons for which companies hesitate to sell their data relate to uncertainties that organizations seem to have about how they can further use the data, may they be legal (perhaps a poor understanding of the General Data Protection Regulation, GDPR), security (probably partially related to the legal aspects, as well) or commercial. Some respondents also reported that they do not own valuable data, an evaluation which will be interesting to follow up on in our large-scale survey.
Platform output
Finally, in order to understand what different users are expecting from a Data Valuation component, we proposed several possible types of output and asked the participants to rate the importance of each of them:
Short summary of the dataset. All respondents deemed this output to be at least “important” and 53% of them considered it “highly important”;
Quality assessment of the dataset. All respondents deemed this output to be at least “important” and 68% of them considered it “highly important”;
Economical value of the dataset. There was less agreement on the importance of this type of output; however, 79% of respondents did rate it as being at least “important” (26% “highly important”);
Exploitability. The component might suggest to the user a set of applications relevant to the given dataset in different domains. Most users (90%) also appreciate this information as being at least ”important”, but there seems to be less consensus regarding its degree of importance.
As before, we asked the users to suggest other types of outputs that they would expect from a Data Valuation component:
- Technical and business metadata: such data could be included in the summary;
- Data samples;
- Exclusivity – how many times that data has been sold or used, based on the premise that “rare” data is more valuable.
In the next stage, these insights were used as a reference to formulate the functional requirements for the Data Valuation component.