Alexander Georg, Infinion, WP 7
Synthetic data make an important contribution to data analysis and research. They are commonly described as “any production data applicable to a given situation that are not obtained by direct measurement” (Parker, 1984). Qualified synthetic data (QSD) provide an intelligent way to create test data that reflect more than just the struture of the dataset, but also preserve the semantics and meaning of the data while guaranteeing privacy (Machanavajjhala et al., 2008).
Three key points of QSD to be considered are:
- Qualified Synthetic Data remove the necessity to use real data and are thus eradicating the risk of data breaches, unwanted exposure and data compliance
- Data is still meaningful and an approximation of real data
- Simulations and tests can be run as with real data
Besides methods such as simulation models and neural networks, statistical methods represent a key way to create synthetic data. Infineon has chosen to apply the statistical method for the creation of synthetic data. Thereby the key element is to design a statistical model from the original data and then create samples from the model (Machanavajjhala et.al., 2008). As a starting point, the data for one product line and one business month have been analyzed to create synthetic data. The procedure is described in the following paragraph.
The source data is collected internally at Infineon from an order tracking tool measuring order lead times. In this context, all relevant parameters for Lead Time Based Pricing (LTBP) are synthesized. These parameters include Order Entry date, Requested Order Lead Time, Confirmed Order Lead Time and Order Volume.
The formulas for the calculation of Requested (OLTreq) and Confirmed Order Lead Time (OLTcfmd) are as follows:
Equation 1: Requested Order Lead Time
𝑂𝐿𝑇𝑟𝑒𝑞 = 𝑊𝑇−𝑃𝑂𝐷𝑎𝑡𝑒
Equation 2: Confirmed Order Lead Time
𝑂𝐿𝑇𝑐𝑓𝑚𝑑 = 𝐾𝑇−𝑃𝑂𝐷𝑎𝑡𝑒
Hereby, WT stands for the Customer Wish date for the delivery, KT represents the confirmed delivery date by Infineon and PODate equals the Order Entry Date.
Primarily, data was sorted in descending order. Next, with the help of Excel and R, an underlying function out of a pool of the common statistical distributions has been identified. Using R, other functions, e.g. normally distributed functions, have been added in order to better fit the real data and achieve an R² value > 0.96. In a graphical validation, comparing the real data histogram and boxplot with the synthetic data histogram, validity of the synthetic data further has been proven. Figure 1 demonstrates the fit between real data in black and synthetic data (blue line) for the Confirmed Order Lead Time. Figure 2 displays the histogram comparison between real data on the left and synthetic data on the right.
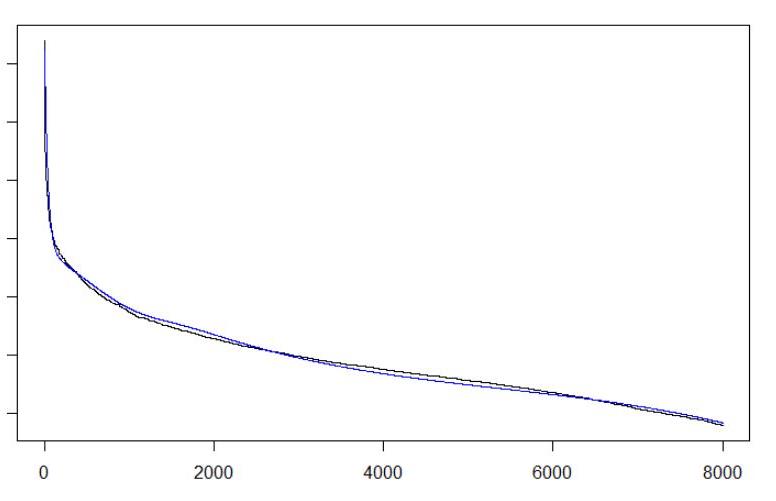
Figure 1: Line chart comparison of real and synthetic data
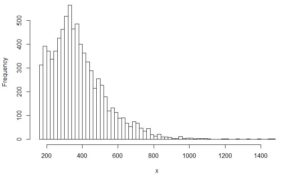
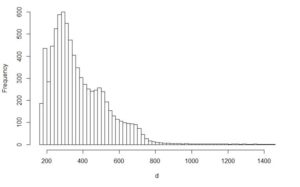
Figure 2: Comparison of Histograms
Another important aspect is protection of sensible customer- and product-related data. Therefore, every customer and every product receives a unique number. By leveraging these figures, customer shares can be displayed without handing out confidential information. Figure 3 presents the final table combining the synthetic data.
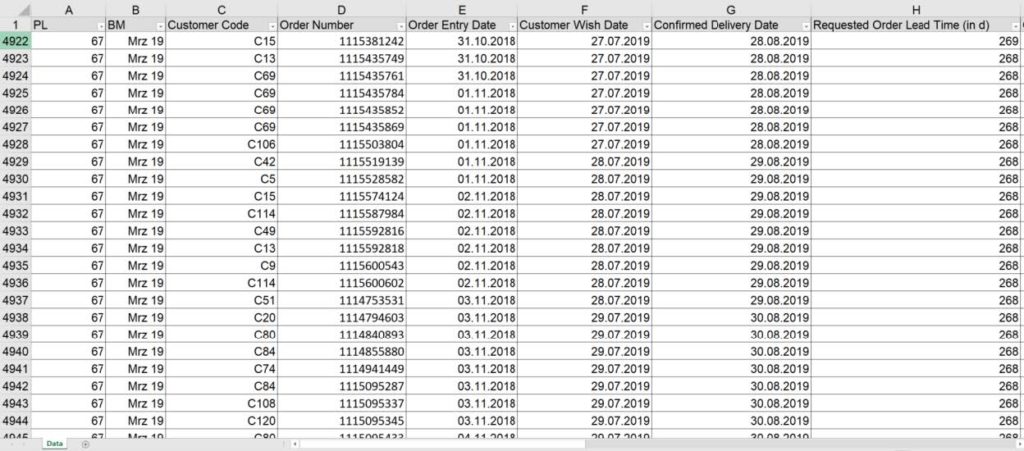
Figure 3: Extract from Final Table for the Synthetic Data
In a next step, QSD for all business months from January 2018 onwards will be created and all product lines will be included. The data will then be used to test relevant algorithms for the introduction of LTBP.
References:
[1] Parker, S.P. (1984). McGraw-Hill dictionary of science and engineering. McGraw-Hill, New York.
[2] Machanavajjhala, A., Kifer, D., Abowd, J., Gehrke, J., Vilhuber, L. (2008). Privacy: Theory meets Practice on the Map, Proceedings of the 2008 IEEE 24th International Conference on Data Engineering, IEEE Computer Society, Washington, 277-286.